
It turns out our friend Evan Shapiro, who is rapidly becoming one of the more influential and honest brokers and truth-tellers of media measurement on the planet, had much more up his sleeve besides the fact checking of the latest Netflix data dump he promised last week. Yesterday, in what he announced as a preview to a larger presentation he plans to unveil at next month’s ADVERTISING WEEK NYC, he announced what he contends is a revolutionary, and frankly needed, way to look at data crucial to the business transactions that media still relies upon:
 Our new (collab) report is called The Score. The Score employs Comscore’s BIG DATA: A combo of Comscore TV, Connected TV Intelligence, and Smart TV information, from 22 million US households. This allows us to generate a unified view of TV ad exposure, across Pay TV, Broadcast, and Streaming, nationally and at the market level. Importantly, this free monthly report will offer everyone a first-ever apples-to-apples comparison for SHARE OF AD-SUPPORTED VIEWING. So much of the current conversation around CTV viewing is shrouded in a fog of confusing data. This collab counts the data that counts.
There is little argument that advertisers do not view the media ecosystem in the same manner that creatives and behaviorists do. From the first days of radio, through to the earliest days of television, it’s always been about how many people are hearing, seeing and engaging with messages, and how many bars of soap or clickthroughs are generated. Significant changes in media measurement have been directly related to advertiser demands. Peoplemeters were introduced and the household-centric measurement model that Nielsen and Arbitron (Google it, millennials) used because they realized younger households were more likely to buy products and were more malleable to messaging, thus creating a demographic-based buying model where the demand for more accurate and timely measurement beyond a two-week delay arose. When time-shifted viewing and the ability for viewers to fast-forward through ads gained traction, advertisers developed their own internal projections for what proportion of program viewing was happening with commercials and challenged Nielsen to produce data that would show that. Linear content providers then countered with the equally existential notion that since more people were watching shows on delay, certainly not everyone was proactive enough to fast-forward, hence there was likely significant incremental audience out there as well. That produced the concept of multiple streams of data that has now evolved from bonus viewing to the de facto negotiating norm of live-plus-seven and, in more extreme versions such as live-plus-30 or live-plus-90 (in Netflix’s case, as much as live-plus-180) has become the standard on how streaming content is measured.
Since Nielsen is anything but perfect and completely inclusive, points we’ve hammered home on numerous occasions, that has opened the door for competitors to take a stab at their one-time monopoly. Comscore has carved out strong street cred because of what it purports to be a dramatically larger and more inclusive panel size. a point Shapiro drove home immediately. But as insiders have pointed out, exactly what level of detail we’re getting from those 22 million households, and from which contributors to the total CTV pie, is far from perfect as well.
For one thing, their methodology is set top box based, which offers the opportunity for scale and detail that I’ve often compared to a 4K TV vs. analog. But we exist in a world where over-the-air TV now encompasses 15% of all households and broadband-only defines 35% of them. Those facts might explain why, per THE SCORE’s initial findings, so much commercial viewing occurs on traditional broadcast networks. And it’s arguably a necessary but often forgotten fact of life that, frankly, individual broadcasters aren’t able to message effectively in a world where perception is often reality.
 But when one looks at results that shows something like Hulu, a service with a significant VMVPD component, rising above the tide, the question arises as to what’s contributing to their aggregate? Is there really THAT much viewing of its ad-supported tier of unique content, or is, as it has been found with Nielsen’s GAUGE report, some viewership that actually should be credited to linear programming being ascribed to the platform?
Shapiro makes some compelling and necessary points for why his “a-ha” moments are ones that should resonate with transactionally-focused observers. I found this one which takes particular aim at the tone of superiority which Ted Sarandos takes every time he bestows the world with his “transparency” to be especially needed:
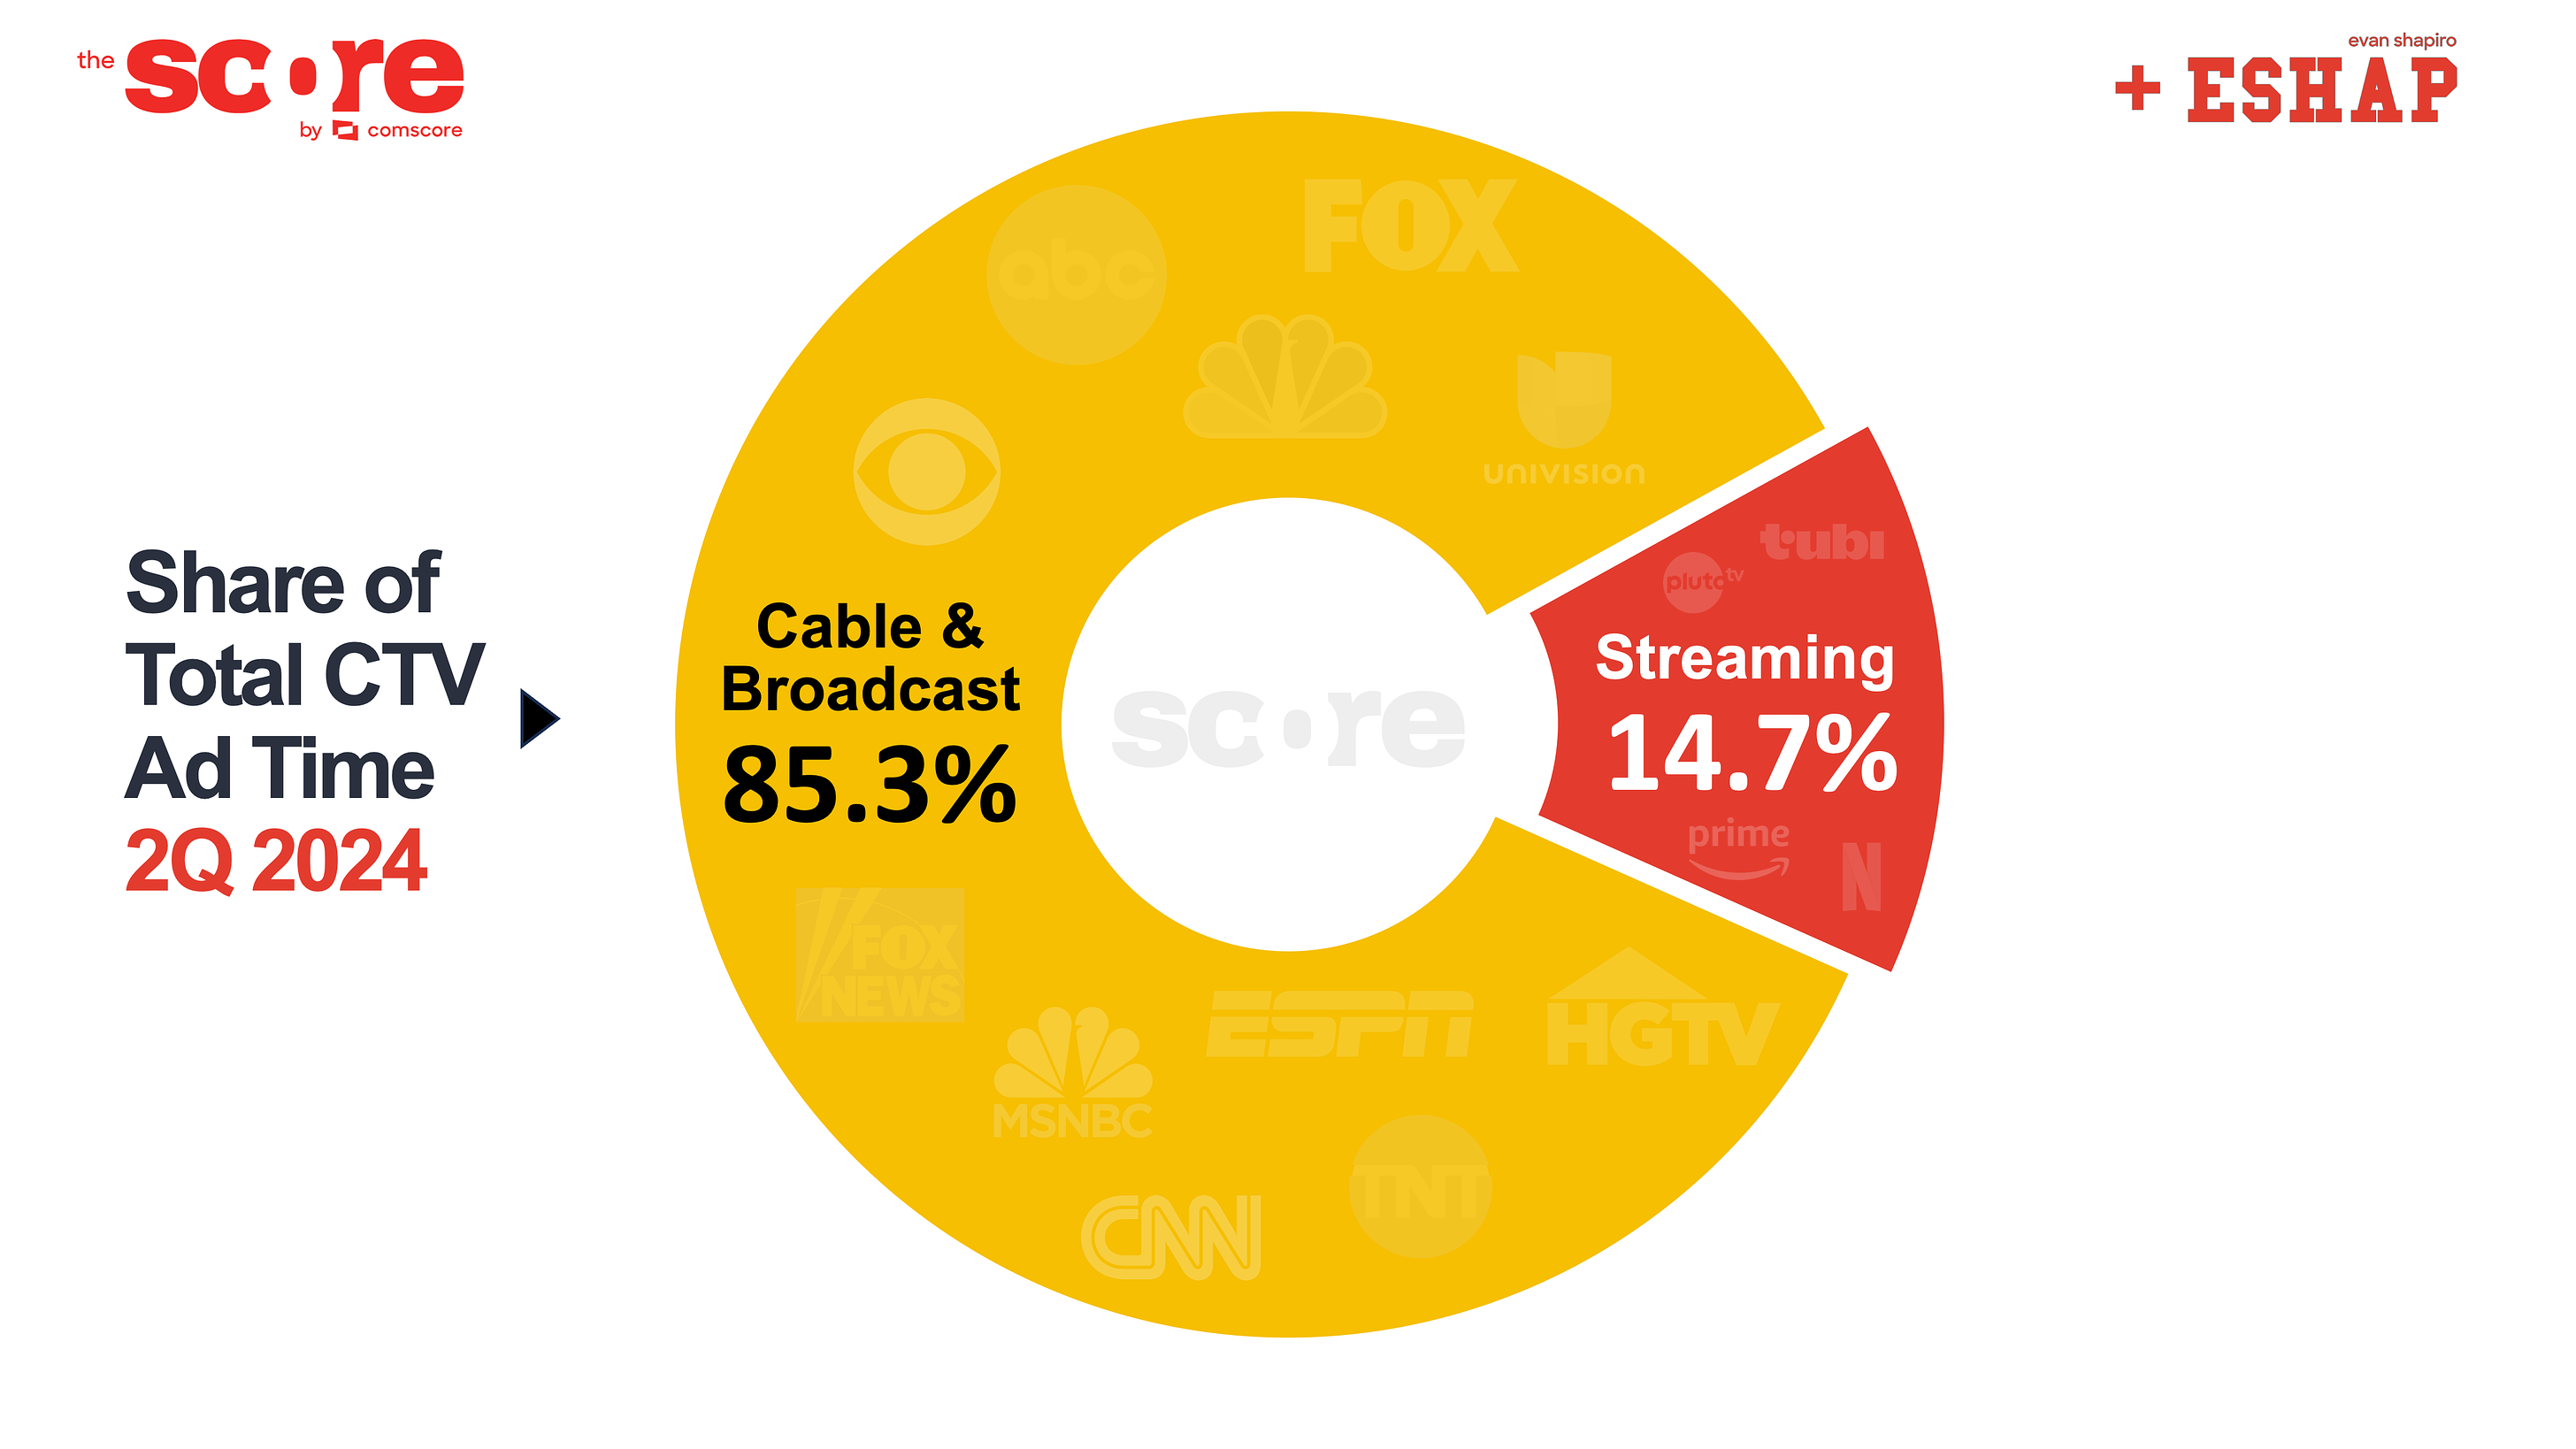
Obviously, streaming garners a large share of viewing on CTVs. But the ad tiers of the big SVODs are still immature, their churn is super high, and their inventory is quite limited. FAST and AVOD are coming on fast (pun intended), but much of their viewing remains fragmented – with notable exceptions, as the next chart illustrates… Despite tremendous audience migration in the last decade, traditional television services continue to retain much of television’s ad supported viewing and therefore demand much more of TV’s advertising dollars.
As we’ve also often pointed out in many previous musings, despite their level of dominance with human beings and zeitgeist, streamers simply aren’t yet as critical to advertisers as they’d like them to believe. Based on the Comscore data, Shapiro takes a particularly sharp edge to those arguments:
Netflix’s ad tier – which launched two years ago – does not crack even 1% of total ad viewing. In April when Baby Reindeer dropped, and May when the latest Bridgerton binge hit, they did manage to rise above the 1% level for a few weeks. But for the entire quarter, Netflix averaged approximately six times less ad viewing than Hulu, which has 33 million fewer subscribers. Amazon, who debuted their new ad tier in January, scored just over 1/2 of 1% share of ad voice.
The problem lies in considering to what degree are those advantages are based upon real differences and how much are based upon methodological vaguaries. And the trajectories we’re seeing in OTA and BBO households are indeed moving in divergent directions. Over time, and with the kind of adoption they’re hoping for, it’s entirely possible that the likes of Netflix and Amazon might make some positive moves.
 And one can’t help but wonder if Comscore’s motivation to get this word out there through the credible and outspoken Shapiro just might be motivated in part by their own precarious financial position, one where insiders question whether this is a hail mary for their shareholders to get something out of their investment, which has to date resulted in many of the top Comscore executives leaving the company and questioning its long-term viability.
Look, we’ve established this is a transactional business first and foremost. Who’s to say this “collab” isn’t yet another reminder of that?
Until next time…